 Andy Lundberg
- Insight
- Posted
Thermal bridging: risk & opportunity
Assessment of thermal bridges is the low hanging fruit lining the path to passive house and low-energy building, according to leading thermal modeller Andy Lundberg of Passivate, who says that taking the time to understand thermal bridging and to minimise and calculate it properly is essential to delivering cost optimal low energy buildings without an Achilles heel.
“In an industry which has become obsessed with three-dimensional modelling, design, planning and visualisation, and where sustainability is on the tips of everyone’s tongue from design to concept stage, we are in the vast majority of cases only measuring heat loss from buildings in one dimension.”
The importance of thermal bridge assessment has never been as prevalent as it is today, and it is about to become even more so with the onset of nZEB (nearly zero energy buildings) and imminent changes in Ireland to Part L for non-domestic buildings. And yet despite tougher building regs and a surge of interest in the passive house standard there hasn’t been any significant palpable change in our knowledge as an industry in terms of what thermal bridging actually is, what the regulations require us to do when it comes to accounting for thermal bridging in buildings, how we minimise thermal bridging effects at design stage, where it sits in the overall context of a BER or Sap assessment and so on. Thermal bridging is a known unknown that gets tossed around like a hot potato. No one can deny its existence and the fact that it can’t be ignored, in fact most professionals involved in building design will attest to its importance, but nobody wants to be the one to do it. And for those who haven’t crossed the threshold of taking an in-depth look into what thermal bridging is, there is a warm fluffy cushion for them to rest on, a place of sheer bliss for which a ticket can be purchased at the price of some extra insulation here and a heat pump there. This place is otherwise known as ‘the default value hotel’. But little do most of the guests know that the hotel is about to enter administration.
So before we go on to talk about thermal bridging in the context of nZEB, passive house and Part L compliance, let’s take a step back and look at thermal bridging for what it really is, where it comes from and what the numbers tell us. The first thing to know about thermal bridging is that it’s nothing new. Early cave dwellers, who made excellent use of cliff-face orientation, thermal mass and form to create comfortable environments in all seasons, didn’t crack the thermal bridging issue either.
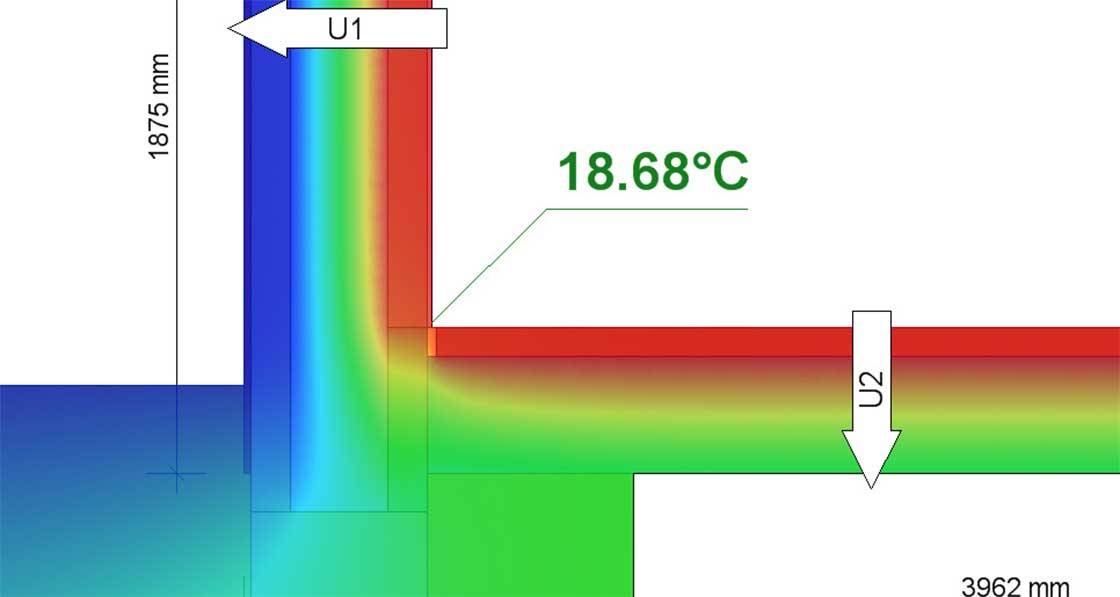
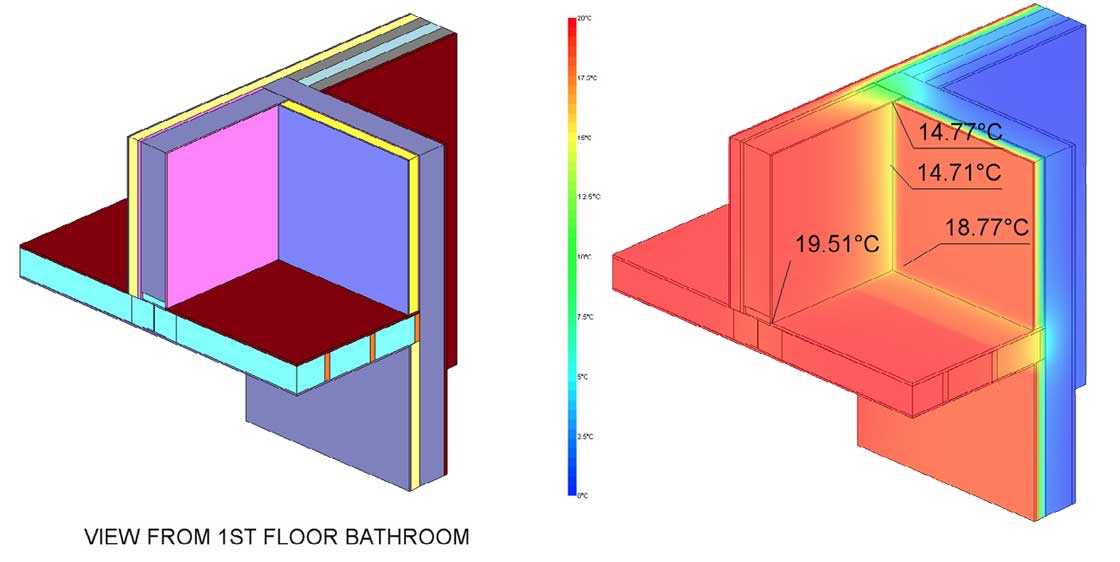 Psi-therm 3D modelling of a Dublin retrofit which ended up with a line of mould in the kitchen ceiling and upstairs bathroom wall.
This article was originally published in issue 16 of Passive House Plus magazine. Want immediate access to all back issues and exclusive extra content? Click here to subscribe for as little as €10, or click here to receive the next issue free of charge
Considering however that we as a human race are now planning a manned mission to Mars, relatively speaking our progress in dealing with thermal bridging has moved at glacial speed by comparison. So what we do know is that all buildings suffer from the effects of thermal bridging, and that is completely unavoidable. What we can do through knowledge, good design and use of finite-element analysis, is reduce its effects insofar as reasonably practicable, sensible and affordable.
When it comes to thermal bridge assessment, there are two things we want to look at. One is the additional heat loss attributed to the junction in question, and the second is the risk of any surface condensation – and related subsequent mould growth – occurring. In terms of measuring additional heat loss at junctions, this is important so that we can be sure that our buildings are only specified with the amount of insulation and quality of windows etc. that the building actually needs in order to comply with building regulations as well as ensure occupants have an optimal living environment, without unnecessarily forcing self-builders, contractors or developers to put in more than is necessary, just to get green tick boxes in a Deap or Sap compliance check.
The same applies to passive house design and PHPP, but the way passive house design is assessed has a high degree of built-in safety when it comes to the inclusion of heat loss from thermal bridges.
It’s common knowledge that investment in insulation is a no-brainer for poorly insulated buildings, but that the returns on investment diminish greatly with every additional millimetre installed above a certain level specific to each building. This was a core aspect of the development of passive house back in 1995, and the recast Energy Performance of Buildings Directive also now requires us to build in a cost-optimal way. So only spend what you need to spend in order to create an environment which is affordable to build, affordable to live in, comfortable and hygienic.
In order to do that however, we need as much information as possible about what is getting input to the building design. Absolutely detrimental to that goal is the use of default performance values. What may seem like a quick and easy way out of a knowledge-gap issue may inevitably hit you square in the pocket, and that is completely avoidable.
When measuring overall building fabric heat loss, we are all extremely comfortable with the term U-value as well as the concept of what it is, right? I know this because in a recent casual poll of 40 building design professionals, I asked if everyone knew what a U-value is, and they all raised their hands. When I asked if they could readily calculate one, given the right information, less than half kept their hands up. Asked if they could accurately describe the concept to an unknowing stranger, we were down to 12. The elephant in the room there was the fact that there were people who were happy to calculate something that they then couldn’t really describe to a stranger. There is a wider issue there! When further probed about what the units of a U-value were, we were down to eight. And when asked if they could describe well what those units represented and how they were arrived at by calculation, we were down to two. So maybe we’re not as comfortable with the heat loss calculation and U-value concept as we thought. And we’d do a whole lot better to just admit that and start doing something about it.
What a U-value does tell us is how much heat energy in Watts is being lost across a given square metre area of a building element, for every one-degree temperature difference between the heated internal space and the outside world. The relationships are linear, so if you double the area of a building element, you double the heat loss. Similarly, if you double the temperature difference you also double the heat loss. The U-value is mainly dependent on the thickness of materials used to build the element, and their thermal conductivity. The thermal conductivity is measured in Watts per metre and Kelvin, where the ‘metre’ describes the heat loss across the thickness of the material from inside to outside, and Kelvin describes the temperature difference between the inside and outside. The incremental difference between 1C and 2C and 1 Kelvin and 2 Kelvin is exactly the same, it’s just that Celsius is used to describe a temperature, and Kelvin is used to describe a temperature difference.
So when it comes to how good an insulator is at resisting heat loss, the thermal resistance will increase with either increasing material thickness or decreasing thermal conductivity. The overall U-value is calculated by adding the total thermal resistance of all layers in an element, as well as a small amount of resistance provided by a thin air layer which is bound to the surfaces of the element, and inverting them. That’s why high thermal resistance is accompanied by a low U-value. The higher the resistance gets, the lower the transmittance, or U-value becomes. As mentioned at the top of the paragraph, its units of measurement are W/m2K. The m2 describes the area of the element in question, with the heat loss occurring perfectly perpendicular to the surface of said element. However, ultimately, the U-value is dependent on values of thermal conductivity (or equivalent thermal conductivity for air cavities, in which radiation transfer is the predominant mechanism of heat transfer), which are measured in only one direction, based on thickness. And so in an industry which has become obsessed with three-dimensional modelling, design, planning and visualisation, and where sustainability is on the tips of everyone’s tongue from design to concept stage (either because it’s good for marketing or just the right thing to do), we are in the vast majority of cases only measuring heat loss from buildings in one dimension. It would be embarrassing only for the fact that almost no one has taken that fact on board. There is great comfort in numbers.
The other two dimensions of heat loss, ie heat loss which can’t be described by a U-value, are measured by carrying out thermal bridge assessment. Heat loss in the second dimension is linear heat loss, and is described by psi-values. If a U-value has units of W/m2K and describes heat loss across an area, then linear heat loss described by psi-values must have units of W/mK. This psi-value describes the heat loss linearly between two elements, such as where a wall meets a floor or a roof, or at the line of where a window meets a jamb, lintel or sill, for example. It’s calculated by building a thermal model of the junction in question in 2D and determining the additional heat loss where the two elements meets.
Similarly, additional heat loss in the third dimension is described by chi-values. These describe single point penetrations of the building fabric, such as a steel column penetrating a floor slab down to foundation, or even a simple cavity wall tie. They can also represent the additional heat loss at the point where three or more planar elements come together, such as at the base of an external wall corner junction with the floor. Because these singular points don’t have an area of length that can be measured, their units are simply Watts per Kelvin heat loss, or W/K. So each of U-values, psi-values and chi-values all describe heat loss in Watts, dependent on temperature difference across an element, but the differentiator between them is whether they describe the heat loss across a square metre of a single element, the linear length of the junction between two elements, or just the dimensionless penetration of an element.
But what actually determines the psi-value or chi-value – what is it dependent on? What might seem the first and most obvious thing is the way the junction is put together and what materials are used in its construction, and that certainly plays an enormous role. When it comes to a first pass look at thermal bridging in a building, a simple exercise to carry out is to take construction drawings in plan and section, and place a pencil at any point on the primary insulation layer. Then run the pencil around the building perimeter. You shouldn’t have to lift the pencil to get from the primary insulation layer in one element to the primary insulation layer in the next. If you do, then you most likely have a thermal bridging issue, in most cases caused by a structural element, that you will need to deal with. It’s no guarantee that the junction is going to cause an issue in terms of additional heat loss or mould growth risk, but it’s certainly something that absolutely needs to be looked at before proceeding any further.
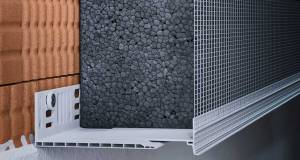
The good news is that there are some very novel products coming onto the market all the time which can deal with these problem spots. These include aerated concrete blocks, high-density and bearing strength EPS which can dramatically improve heat loss around window junctions, recycled glass which resists both heat and vapour transfer, and polyamide/ nylon plates for steel-to-steel connections and steel-to-concrete connections, among many others. The key is to use the right thing in the right place, and that requires knowing where the problem is and why it’s occurring, and having the product knowledge to be able to select the right product for the job.
The most obvious contributor to the magnitude of a psi-value is the way we actually measure our buildings for the purpose of Sap, Deap or PHPP calculations. However, in terms of what determines the psi-value it is equally, if not even more influential than the components used to assemble the junction in the first place. If we take the example of Sap or Deap calculations, in accordance with convention the building is measured internally. As we discussed earlier, when we describe heat loss using U-values, we only describe heat loss at a right-angle to the surface of interest. So by measuring the building internally, when we come to any outward-facing junction, such as an eaves, ground floor/wall junction, external wall corner etc. there is essentially a hole in our calculations, as we’re limited to a one-dimensional heat loss calculation, and our U-values are blind to the heat loss happening in the second dimension at the junction. So the psi-value accounts for that shortfall.
To put it simply, if we imagine having two wicker baskets which represent the U-values of two walls either side of a junction, each with five apples in them, then adding up the total we would say there are ten apples. But if we model that junction in 2D thermal analysis software, and the result is that there are actually twelve apples, then we know that there must be two apples outside the wicker baskets. These represent the additional heat flow at the junction, which couldn’t be seen by only counting what was in the baskets. It might sound incredibly simple, but that is literally what thermal bridge assessment at its core is doing. What we also see is that typically, by measuring buildings internally for heat energy balance calculations, we are underestimating the amount of calculable heat loss from a building.
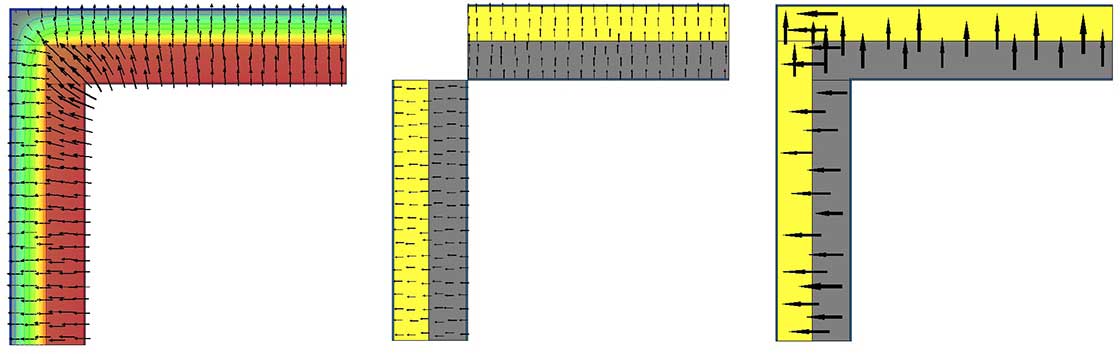
(left to right) How heat loss flows through two connected walls, as simulated by Psi-Therm; that same junction as treated by PHPP; and by Deap/Sap. Note that PHPP overestimates the heat loss, while Deap and Sap underestimate it
Conversely, in passive house, as well as national conventions in many countries, fabric heat loss is calculated by measuring the building externally. Going back to our apple analogy, this is akin to measuring the five apples in the first basket and including two apples from the second. So you come up with a figure of seven apples in the first basket. Repeat this for the second basket, and you now end up thinking you have a total of fourteen apples. But we know that in reality there is still a total of twelve apples, so we’ve over-counted by two, as those apples were common to both baskets. So to accurately account for the total number of apples, we need to subtract two apples from our calculations. And hence we end up with the concept of a negative psi-value which passive house is famous for. However, it’s not necessarily because a particular junction is exceptionally well designed, but to a large extent because it was measured externally, ie over-estimating heat loss in one-dimension, and therefore having to subtract some heat back to get an accurate figure.
There are a lot of myths surrounding the passive house standard and what it really takes to achieve it. One of the most common ones is that you can’t open the windows in a passive house. That question gets dealt with at every passive house conference and seminar. There is also the concept that a certified passive house must have psi-values of 0.01w/mK or less at every junction. That is not the case. For example, in a certified passive house, if the installation of a window is graphically shown to be thermally robust, then it’s not always a requirement to calculate the psi-values for the installed window. The default value then used is 0.04W/mK in PHPP. This is fairly punitive, as a typical passive house window installation loses about half that much heat, so it’s in one’s interests to get those analysed to save having to compensate for them elsewhere. What is true is that to certify an opaque building element — such as a wall system — as a passive house component, the manufacturer does have to come up with standard connection details which have psi-values of 0.01W/mK or less. So you do need to have these psi-values to certify a building system, but you don’t need to have them to certify a building using a non-certified, standard construction system. It’s crucial to know the difference, as these misconceptions are commonly what prevent people from deciding to go down the passive house route in the first place. Indeed, one of the beauties of the passive house concept is that it doesn’t matter how you build it as long as it reaches the target values, and it doesn’t matter how you heat it either as you need so little (national building regulations always apply regardless, and compliance here is heavily influenced by heating fuel type and plant). So the pressure is off. Buildings can be built to the passive house standard and certified with psi-values above 0.01W/mK.
Returning to the wicker basket example, when calculating heat loss in passive house buildings, we are typically over-estimating heat loss by measuring externally. So if we actually calculate the psi-values for junctions in a passive house they’re typically negative values, in order to correct for our conservative over-estimation when doing our energy-accountancy. In this instance, every negative psi-value entered into PHPP reduces the calculated annual heat demand and heat load. In fact, on a number of passive house projects I’ve worked on, a house which has a calculated annual heat demand of 15kWh/ m2yr initially, will reduce to circa 12-13kWh/ m2yr once thermal bridges are entered. So calculating thermal bridges now means that you have 2-3kWh/myr to play with in terms of savings in specification items elsewhere. It’s important that we use that, as the 15kWh/ m2yr target value is not arbitrary, but rather the cost-optimal energy performance value around which the passive house concept is based. Going significantly below this value could well be viewed as wasting money.
The same applies, but to an even greater extent, in the determination of Part L compliance using Sap or Deap. Whereby PHPP allows for individual entries of psi-values, on a need-to-input basis normally, the Deap software only has one single value entry cell for thermal bridging, termed the Y-factor. This is another value around which there are some misconceptions. The Y-factor is not a percentage. It is not a weighting factor. It is also neither a correction factor nor a multiplier.
The Y-factor is a number calculated using the individual psi-values of all the key junctions in the building. The value is area-weighted over the area of the exposed building fabric, so it describes as a whole the amount of heat energy loss (due to thermal bridging) over each square metre area of the building fabric for every one-degree temperature difference between inside and outside. So the units for the Y-factor are W/m2K, which are the same units as those of a U-value. And they can be directly compared. This is also where things start to get scary.
I’ll deal with the Irish situation first, before describing the UK situation. When accounting for thermal bridging in a Deap calculation, we have four options to choose from in accordance with TGD Part L (2011) of the Irish Building Regulations, which are as follows:
4 options
1. Build in accordance with the Acceptable Construction Details and use a y-value of 0.08W/m2K.
2. Build in accordance with a bespoke construction method and use psi-values calculated by an accredited member of the NSAI Thermal Modellers Scheme or other equivalent accreditation scheme to determine the y-value.
3. Build using a blend of both, and use a combination of the values provided by an NSAI-accredited modeller (or similar) and the values from Tables D1-D6 in TGD Part L (2011) to determine the y-value.
4. Do not determine any individual psi-values and simply input a y-value of 0.15W/m2K.
The method used in point one is the commonly applied method in Ireland. In a study of building energy ratings submitted in Co Dublin for new-build housing from 2005 to present day between 75 – 174m2, 62% used a 0.08W/ m2K y-value for thermal bridging. This is effectively a statement that all key junctions in these buildings were built in accordance with the Acceptable Construction Details, and without a single key junction deviating from that. If a house has an average area-weighted U-value for all elements of 0.16W/m2K, for example, this would mean that 33% of fabric transmission heat loss is due to thermal bridging. This is in most cases a gross over-estimation. In order to demonstrate compliance with Part L, this apparently poor fabric performance due to thermal bridging will need to be compensated for elsewhere, be it via investment in thicker insulation in another part of the fabric, or investment in renewable energy plant, for example. Either way, money will need to be spent unnecessarily. In most cases, it’s more cost-effective to calculate the bespoke y-value for a building, than to use the 0.08W/m2K y-value and invest in other measures to compensate.
The method used in point one allows for a combination of sources of details including the Acceptable Construction Details. The majority of these details, and their related psi-values published in Appendix D of TGD L (2011), are not optimised details and therefore may not offer the best details in terms of reducing heat loss at junctions as well as reducing mould growth risk to its lowest possible level.
The method used in point four of not calculating any specific psi-values but instead using a 0.15W/m2K default value is a high-risk strategy. Again using the average U-value of 0.16W/m2K for a given house, assigning a y-value of 0.15W/m2K means that the Deap calculation estimates that 48% of fabric transmission heat loss is from thermal bridging. That is a ridiculous concept for most standard houses. Compared to using the value in point one of 0.08W/m2K, the amount of additional investment to compensate for this simply in order to demonstrate compliance with Part L in a Deap calculation has increased by an order of magnitude – more unnecessary waste which is completely out of tune with the fabric-first sustainable building approach as well as cost-optimal considerations. We shouldn’t forget that the Energy Performance Coefficient, or EPC, in Deap calculations is based on a building of equal size to the one in question, albeit using standard reference performance values. The value used by the Deap software for thermal bridging is 0.11W/ m2K. Any number below that entered means you are essentially winning the compliance numbers game, and any above and you are seriously on the back foot. There is one final caveat with the use of the default 0.15W/m2K y-value. By entering this value, the responsible professional is essentially stating, as outlined in TGD Part L (2011), that all the junctions in the building are free from mould growth and surface condensation risk. This implies that either the junctions were assessed using numerical analysis (highly unlikely) or that the responsible professional has the experience to determine visually that no mould growth or surface condensation risk is present. In the current climate and days of BCAR (Building Control (Amendment) Regulations), that is a very onerous approach to take. In the study of BER calculations described earlier, 13.5% had used this value.
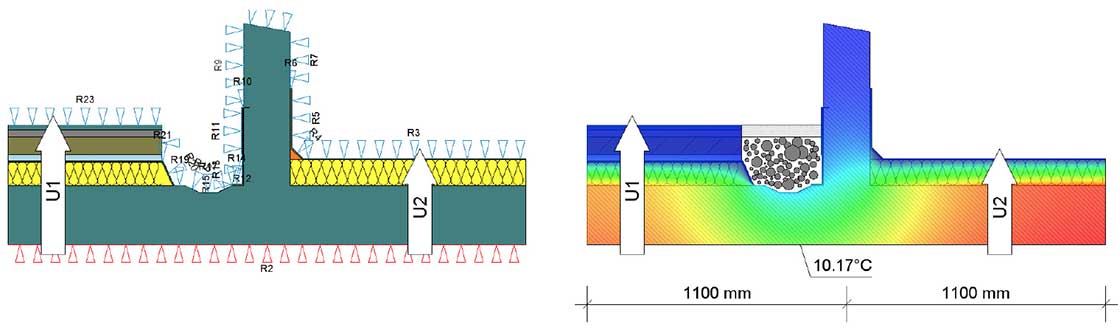
A detail of an upstand on an in-situ cast building. The insulation stops short of the upstand and has a drainage channel, as well as the upstand itself not being insulated. The ceiling below has a circa one metre wide band of mould for its entire length
The method used in point two is the only method which allows the freedom of the user to strive for low thermal bridging values. There are a number of professionals offering the service on the NSAI Thermal Modellers Scheme, as well as a growing number of product manufacturers producing catalogues of thermal bridging values specific to their systems and products. In a recent study I carried out using such a catalogue of optimised junctions, the actual calculated y-value for a standard three-bedroom semi-detached house was just 0.022W/m2K. This represents just 12% of total fabric transmission heat loss, where an average U-value of 0.16W/m2K is used, and can be achieved readily using optimised yet standard construction systems. In the study of BERs mentioned earlier, just 15.5% of submissions availed of this option, however to put that in real figures, there were only 20 discernible y-values, as the majority of submissions in that category used the same y-value on multiple houses in developments. So all in all, the number of design professionals choosing to calculate the bespoke y-value for a given project is miniscule. These are the projects that are achieving the lowest-energy standard and cost-optimal designs. For the rest, there is a lot of catching up to do.
Interestingly, a further 9% used a value of 0.11W/m2K, which is the reference value used by the Deap software in determining the EPC value. However, this value is not and never has been quoted in any TGD Part L document as being an input value for thermal bridging in a Deap calculation. Offering the benefit of the doubt, this too could be a bespoke calculated y-value which coincidentally matches the reference value.
The situations in the UK (England, Northern Ireland, Scotland and Wales all have separate building regulations) and Ireland regarding how thermal bridging needs to be accounted for in a Sap or Deap calculation are very similar, however the differences are important. Under the various UK regulations (both English and Welsh Part L1a, Scottish Section 6, and Northern Irish Part F) where a building is constructed in accordance with the Accredited Construction Details (which differ in Scotland) the psi-values for each junction are taken from table K1 of the Sap document. However, this table is extremely limited in the information it provides. Firstly, there no distinction between any ranges of U-values for elements flanking the junction. The reality however is that the psi-value is heavily influenced by the U-values of the elements either side of the junction. Secondly, the values are not specific to any construction type, even though the differences in psi-values for the same junction, between externally-insulated masonry, full-fill cavity wall and partial-fill cavity wall with internal insulation, can be very significant. The same is true for all construction types.
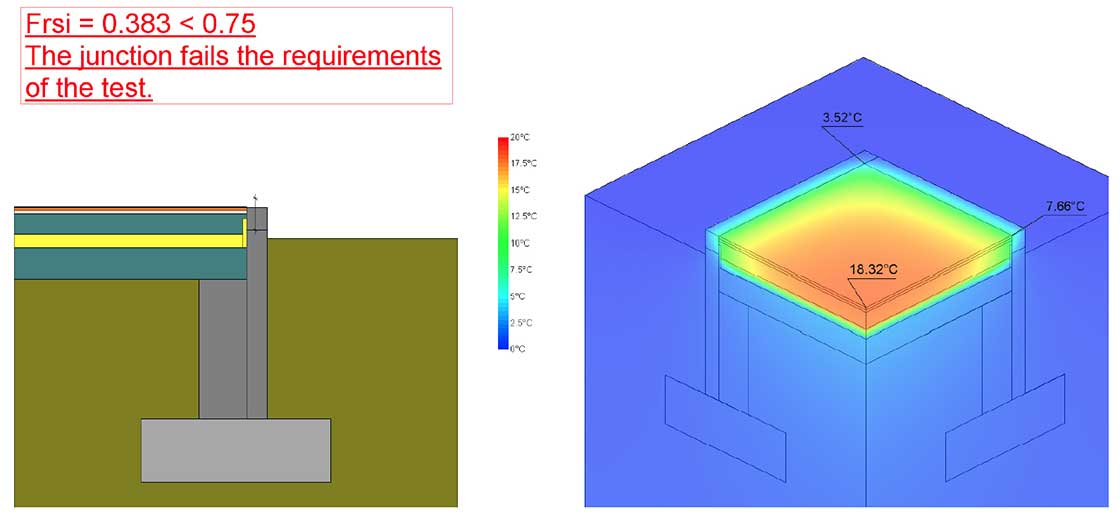
This is a kitchen extension built in 2010. The fRsi requirement in building regulations is still 0.75 at the linear junction and 0.7 at the point corner. This kitchen was suffering from massive condensation at the glazing base, as well as differential expansion due to moisture causing tile cracking. As you can see, the frame sits on the outer leaf block which runs all the way up from the strip. Perimeter insulation was installed but due to poor levelling, the screed over-ran it considerably at the top so it was rendered quite useless. Once tile adhesive and tile went on, a very poor junction was presented.
Where a junction is not built in accordance with the Accredited Construction Details (England, Wales & N Ireland), the applicable approved psi-value cannot be taken from table K1 of the Sap document, but is rather taken from the default column of table K1. These values are in almost all cases exactly double the approved value. So we have an unfortunate case in which neither the approved values nor the default values in any way accurately describe heat losses from thermal bridging for a given project, unless by absolute and highly unlikely coincidence. This fact is made even more disappointing by the fact that compliance with Part L1a demonstrated by a Sap calculation requires a target fabric energy efficiency (FEE) value to be achieved, meaning that a fabric-first approach is required. Sap assessors are therefore very in tune with the idea that decreasing heat loss from thermal bridges is essential in achieving compliance.
Common to all jurisdictions is that psi-values can be obtained from a competent assessor. Under Part L1a, a competent assessor is someone who has received training in thermal bridge assessment and completed a series of validation cases from the document ‘BR 497: Conventions for calculating linear thermal transmittance and temperature factors (BRE Press, 2007)’, and obtained values within stated tolerances. Competence is therefore self-certified, and the enforcement of this requires the party commissioning the assessments to know to ask this question of the assessor.
In Ireland, assessors who wish to provide calculated bespoke psi-values for the purpose of input to a BER/Deap calculation must be members of the NSAI Accredited Thermal Modellers Scheme, or similar approved, as outlined in TGD Part L (2011). Entry to this scheme is via two paths, with one being the submission of a portfolio of work and completion of further assessment by the NSAI, and the second being by successful completion of a one-semester course in thermal bridge assessment at Dublin Institute of Technology, which I deliver. Uptake on the scheme has been slow, which may be in no small part due to the lack of perceived importance of thermal bridging as a means to reduce unnecessary design and build expense, due to the fact that Part L compliance in Ireland doesn’t require a fabric-first approach beyond achieving back-stop U-values and making up the rest of the numbers with bolt-on renewable technologies.
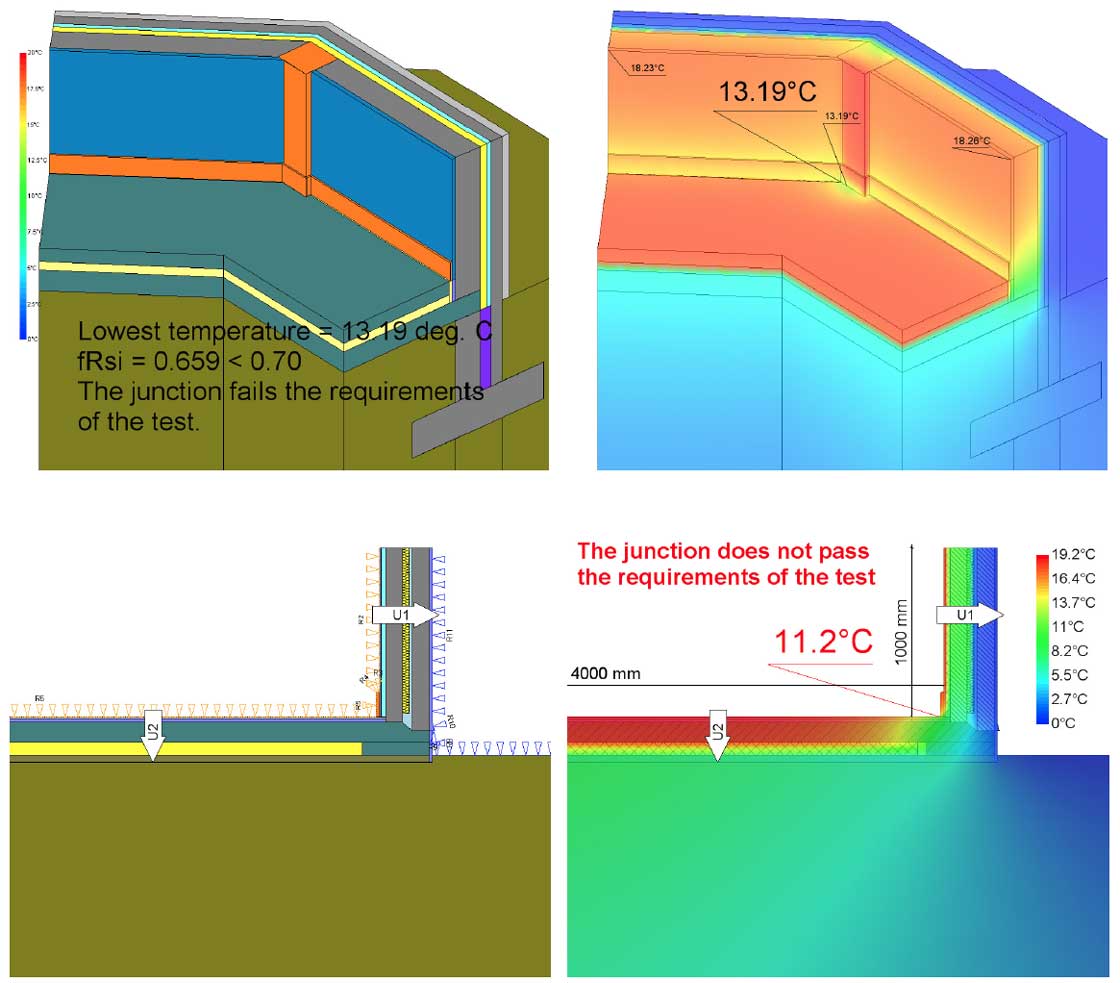
(above) This appalling detail is a kitchen extension that was built straight off the top of patio slabs without foundation – by a contractor. It was shuttered to form a thin raft and then had cavity wall and screed built over it. Total continuity of concrete from inside to outside; (top) The corner of this conservatory wall failed to meet the fRSI requirement at the wall to floor corner junction due to a steel element beneath a softwood post in the build-up at that point
It would seem that all the aforementioned countries have a thing or two to learn from each other when it comes to ensuring competency of assessors in the public interest, government-body provision of thermal bridging values specific to construction types and U-values, and implementing a fabric-first approach to regulatory compliance.
“The 15kWh/m2yr target value is not arbitrary, but rather the cost-optimal energy performance value around which the passive house concept is based. Going significantly below this value could well be viewed as wasting money.”
Given our current obligations under the Energy Performance of Buildings Directive, coupled with the introduction of nZEB for all public buildings in 2018 followed by all new buildings in 2020, it will be increasingly difficult to demonstrate compliance with each relevant standard via the use of default thermal bridging values. Given that in Ireland the current required MPEPC (maximum permitted energy performance coefficient) for Part L compliance is 0.4 (representing a 60% improvement on 2005 values), the nZEB standard requires an MPEPC of 0.302 be achieved. Optimisation of junction design, coupled with bespoke calculation of the related y-value, can go a long way toward achieving this value alone without any further measures. It is without doubt a fact that there are a number of dwellings being built at present which are already nZEB-standard, disguised as standard Part L compliant buildings, purely because of the use of a default y-value in their BER calculation. They are not getting credit where credit is due. Associated with each of those is a real monetary value for the additional measures which were implemented in order to compensate for this. We don’t need to be cherry picking expensive solutions when the reality is that assessment of thermal bridges is the low hanging fruit lining the path to nZEB, passive house and low-energy building.