

- Heating
- Posted
Thermal bridging

U-value alone is a blunt instrument for gauging the thermal performance of a building. Ground-breaking eco architects Joseph Little and Beñat Arregi of Building Life Consultancy explain why our increasingly ambitious insulation efforts must involve a rigorous attention to thermal bridging if we’re serious about creating low energy, healthy buildings.
Plane element heat loss1 and thermal bridging2 together constitute all the conduction heat loss (measured in W/K, watts per kelvin) through the thermal envelope3 of a building. Perversely, insulating the plane elements more and more without carefully dealing with junctions can lead to a significant increase in thermal bridging heat loss. This is often more significant in poorly thought-out energy-focused retrofits than in existing or new buildings.
Proving the nature and extent of this Achilles heel was the key point in part III of the Breaking the Mould series of articles previously published in Construct Ireland.4 A year and a half later we return to the subject for several reasons, armed with our own deeper understanding. A year of teaching ‘Designing Low Energy Domestic Refurbs’ at the RIAI has shown us the confusion that still surrounds thermal bridging. Amazingly and unacceptably, TGD L(2010) will contain the same misconceptions relating to thermal bridging that TGD L(1997) had, while the passive house standard – with its strong focus on thermal bridging – is becoming increasingly popular, and the NSAI are starting to consider a thermal bridge assessor certification scheme. We believe the Industry is ready to take thermal bridging seriously.
Breaking the Mould part III featured a study of the impact of alternate ways of externally insulating a particular house. A key aspect of the work was to compare the total energy loss through plane elements (W/m2K) with energy loss through thermal bridges (W/mK). We did this by bringing the energy loss of both forms to the same units (W/K), thus allowing a direct comparison. The result was fascinating because we were able to prove that while insulating the plane elements (walls in that case) reduced the U-value, the heat flow associated with thermal bridging at junctions (Ψ-value) increased not only proportionally but also in real terms: it trebled in size from the original building to the first retrofit version. The sill junction is a good example: the interruption of the insulation at the concrete sill left the total heat loss virtually unchanged in that area but it did change its attribution from thermal transmittance to linear thermal transmittance (or from U-value to Ψ-value).
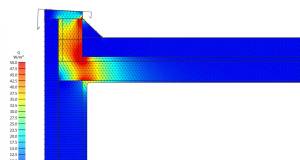
The diagrams in figure 1 are powerful educational tools in that they show this clearly. If the upgrade is done with care and an awareness of thermal bridging, it is possible to reduce thermal bridging significantly, as shown by the detail at the bottom. Regrettably, while the development of the Acceptable Construction Details (ACDs)5 and tables D1-D5 in the soon-to-be-issued TGD L(2010)6 are a welcome and marked improvement on guidance for new-build, there are still other elements of guidance for thermal bridging in new-build and retrofit that are poor and some of them (such as diagram 2 in TGD L)7 are totally misleading.
The junction of culture and energy flows
We believe the origin of the confusion and inaccuracies is as much cultural as it is to do with the difficulty of calculating energy flows. We can say this because, though energy loss through the building envelope is of course real, U and Ψ-values are concepts and calculation methods that scientists invented to aid the construction industry in calculating and controlling these heat flows.8
1This is the uniform heat loss through an element of the external envelope, like a wall or floor. It is measured as thermal transmittance or U-value with units of W/m²K.
2This is the additional heat loss at junctions of plane elements, that is, the extra over heat loss at that point not measured by U-value. It is measured as linear thermal transmittance or Ψ-value with units of W/mK.
3It’s ironic that something as ephemeral as an envelope is used to describe something as robust as the portion of the building that protects and insulates the internal spaces from the weather and cold outside.
4Issue 8, Vol. 4, July 2009
5These are available in the technical guidance section of the Department of the Environment website, www.environ.ie.
6Technical Guidance Document L(2010) deals with the conservation of fuel and energy in new and existing dwellings. It is a significant revision to TGD L(2007) and went out to consultation before Christmas 2010. It should be signed into law within weeks of the new government coming to power.
7In the isotherm diagrams warm colours indicate warmer temperatures, while in the thermal flux diagrams warm colours indicate faster levels of heat transfer. The graphs on the far right have been derived from detailed calculations and show how plane element heat loss (in yellow) can hugely reduce due to a particular retrofit while increasing the thermal bridge heat loss at the same time (orange).
8Martians no doubt know about π (Greek letter pi) under a different name, but not U and Ψ-values!
At a time when insulation standards were very poor, dealing with the uniform, easily calculated part of heat flow, what we call plane element heat loss (measured from finished internal surface to surface), was enough. From the advent of thermal standards in the early 1980s we got used to talking about U-values, or R-values in North America. The repeating thermal bridges of a timber frame were allowed for, but the extra over heat loss at junctions was small enough that it warranted little attention: our technical guidance and understanding have reflected this view since.9 The construction industry is still so comfortable talking about U-values that one could be forgiven for thinking that this term relates to all the heat loss of a wall or roof, instead of a subset.10
With the advent of a 60% increase in minimum energy standards over TGD L(2005) in Ireland and the Passive house standard gaining increasing acceptance, a radical overhaul in the culture of building, industry norms and the understanding and assessment methods of designers is suddenly urgent.11 Remember reducing thermal bridges through clever design can result in jumping an energy band for certain projects. As that jump in rating can be achieved without increasing wall, floor or roof insulation thicknesses it can be seen as a space-saving and cost-effective measure, or just one part of a super-low energy strategy.
Methods of assessing thermal bridges
The amount of extra over heat loss not accounted for by the U-values must be understood and limited for a design to be truly low energy. It’s true that the non-uniform nature of heat loss through linear thermal bridges makes assessing a value for this harder, but there are plenty of methods to do so ranging from assigned values in a European Standard (EN ISO 14683), tables D1-D5 in TGD L(2010) or other thermal bridge catalogues,12 to manufacturers’ values, the Passive House Institute’s unique approach, or finally, numerical calculation. This last requires mathematical fluency and training and – after the inception of the upcoming NSAI accreditation scheme – may only be carried out by an accredited assessor. However, if the other avenues are known and availed of it may often be unnecessary to perform these calculations.
European Standard EN ISO 14683, which lists simplified methods and default values, suggests the comparative accuracy of different approaches:
When selecting a particular method, its accuracy should reflect the accuracy required in calculating the overall heat transfer, taking into account the lengths of the linear thermal bridges. Possible methods for determining Ψ include numerical calculations (typical accuracy ± 5 %), thermal bridge catalogues (± 20 %), manual calculations (± 20 %), and default values (0 % to 50 %).
p4, EN ISO 14683
Those designing under the passive house standard may avail of the thermal bridge free approach it allows. This approach, which can free a designer of having to calculate the extra over heat loss at all but the most obdurate junctions, is possible because in Germany13 buildings are measured from the outside, which means that plane element heat loss is over-measured at certain junctions allowing a tolerance factor. Also, from previous measurement and experience, the institute has established some rules of thumb that result in low thermal bridging. The irony that the home of super-low energy and mind-numbing calculation allows rules of thumb for thermal bridges is striking, but they know what they’re doing.

Figure 2: sketches showing how the Irish & British measure building fabric from the inside and Germans from the outside
Point thermal bridges, which occur for instance in wall ties or where three planes meet, are still generally ignored as the heat loss associated is still considered small but the complexity of calculation is not. In time this too may become an issue of concern prompting another cultural shift in the construction industry.
Putting a number on the extent of thermal bridging – Irish style
Appendix D of TGD L sets out the guidance for dealing with thermal bridging in Irish building regulations. It allows two alternative methods for calculating thermal bridging heat loss of a dwelling.
Method A: default Y-value
- Heat loss through thermal bridging is accounted for in terms of a default Y-value or ‘thermal bridging factor’ (in W/m2K) multiplied by the total envelope area of the dwelling.
- The Y-value allowed is either 0.08 W/m2K where the ACDs are used, or 0.15 W/m2K for all other dwellings,be they new, old or retrofitted.14
Method B: calculated heat loss
- Each thermal bridge is entered individually with its linear thermal transmittance or Ψ-value (in W/mK) multiplied by the length of the thermal bridge. All of those are summed up to get the total thermal bridging heat loss.
- Ψ-values can be determined from measurement, numerical modelling or tables D1-D5 in new Appendix D of TGD L(2010) which give calculated values for the ACDs.
- Different sources for Ψ can be combined in the same dwelling, for instance taken from Appendix D for the ACDs that are relevant to those junctions and numerically modelled for those that are not.
Y-values in context
The concept of a Y-value was introduced in TGD L(2007). It represents the thermal bridge heat loss expressed per square metre of envelope area, and is an input in the Deap software. It may seem odd to relate an essentially linear measure to an area but the advantage, if reasonably accurate, is that the Y-value has the same units as the U-value, relates to the same envelope area, and therefore may be directly compared. They may also be combined to get a sense of the full extent of conduction heat loss through the building fabric. For instance for a particular building a Y-value of, let’s say, 0.14 W/m2K could be added to an averaged U-value of 0.44 W/m2K to show us that 0.58 W/m2K is the full extent of fabric heat loss. Several countries do exactly this in trying to arrive at a more sensible understanding of heat loss. In countries like Germany, The Netherlands, Poland and Italy they refer to what we call the Y-value as an increment to the U-value denoted ΔU. In Ireland we still maintain the fallacy that if a wall U-value is calculated as being exactly 0.27 W/m2K that will be the heat loss through it once built.
Default Y-values, as listed in method A above, are naturally inaccurate in that they do not take account of the following issues:
- The relative lengths of thermal bridges for different geometries
Compare the lengths of roof and ground junctions in a detached house to those in a mid-terrace, or the sill lengths of strip windows in a modernist villa compared to the tall windows of an Edwardian house. As each sill’s Ψ-value is multiplied by its length and added to that of all other sills, it can be seen that length is key. - The construction system
It can be far harder to eliminate thermal bridges when insulating internally than externally. For instance thermal bridges at intermediate floors simply disappear in the latter system. - The U-value of surrounding plane elements
The heat loss at a junction changes as the U-values of the surrounding plane elements change: it’s not a static value. Typically better insulated plane elements have greater additional heat loss at junctions.
9As an example: TGD L(2007) states that 15mm of insulation with a thermal conductivity of 0.04 W/mK around a window or door is all that is necessary to eliminate thermal bridging. The insulation values and the understanding this represents are antediluvian, long overdue for total change.
10In ill thought-out retrofits the extra over heat loss at junctions can become much higher than the heat loss related to U-value in the surrounding areas. Focusing on U-value only then becomes a distorting exercise that hides the real heat loss.
11Different studies carried out on the continent (consolidated in Impact of thermal bridges on the energy performance of buildings, an EPBD information paper) have measured that thermal bridge heat loss generally represents around 20% of the whole primary energy consumption of a low-energy building. Note that this is so significant that it can easily overcome the solar hot water input.
12These catalogues are popular on the continent. Building Life Consultancy is creating one for the Irish and UK markets.
13And therefore when using the Passive house standard too.
14A further category is dwellings built under 2005 Regs that meet certain standards: confusingly these are allowed a Y-value of 0.11 W/m²K

As the impact of these issues change from building to building it’s a wonder we’re allowed use a single Y-value! Such default figures are of value only when the designer has no other way of assessing the thermal bridge component of heat loss through the thermal envelope. We believe this is really only the case when carrying out a BER assessment of an existing building. The reader will no doubt agree that, unlike the present arrangement, the value inputted in Deap should be a conservative value and broadly relevant to that building type. It would not be hard for the Department of the Environment to tender the generation of a schedule of default Y-values for existing dwellings of different types (including detached, mid-terrace, apartments, etc.) and styles. Selecting a default Y-value from such a table would (a) avoid the dreadful underestimation of thermal bridging that is now happening in some BER assessments (especially for apartments) and (b) would encourage designers engaged in retrofitting to calculate more accurate Y-values to benefit from a better energy rating.

For new dwellings, the Department of the Environment has gone most, but not all the way, down the path of abandoning default Y-values in favour of calculated Y-values. Tables D1-D5 from Appendix D in TGD L(2010) list Ψ-values for all ACDs based on different plane element U-values (see table 1). As pages 36 & 37 of the introduction to the ACDs show a straightforward example calculation, it suddenly becomes easy to calculate a new dwelling’s specific Y-value under the method B approach listed above. By doing so, all three issues listed above are dealt with. Because the Ψ-values of ACD details can be supplemented with Ψ-values of details calculated by thermal bridge assessors, sourced from manufacturers, etc. we now have a robust, easy way of assessing the true extent of thermal bridge heat loss in new dwellings of a wide variety of design and construction types: a great step forward.

To prove how inaccurate the default Y-value of 0.08 W/m2K can be, we calculated the Y-value of each of the construction methods listed in the ACDs for the example house on page 36 of that document, see figure 4. Depending on the construction system considered, we found a variance of 0.05 to 0.12 W/m2K in the Y-value of the very same house design (see table 2). That’s a margin of error of ± 50% on the default Y-value (0.08 W/m2K), due solely to construction method. Moreover, the default figure is not on the safe side: it can underestimate the thermal bridge heat loss. This means that for most projects there is little incentive for calculating the Y-value or carrying out numerical calculation unless a much, much better value is sought.
It is, therefore, a great shame that despite objections from many sides in the TGD consultation period15 before Christmas 2010, the Department of the Environment didn’t get rid of the now unnecessary option of using 0.08 W/m2K as a default Y-value for new dwellings with ACDs. Given its inherent inaccuracy, this is doubly troubling as the ACDs, which until now represented an elective, good practice approach will shortly represent the worst you can do to build compliant dwellings. Bear in mind the department team themselves used calculated Y-values of 0.05-0.06 W/m2K for eight of nine example dwelling types to prove that compliance with TGD L(2010) was achievable.16
In the move to a carbon-neutral construction culture, the standard for minimum compliance of new buildings becomes more and more challenging. The new-build housing sector has the most onerous targets of all to reach but also the best chance of controlling design and construction quality. Once you know what you’re doing, it’s far less problematic than retrofit. Therefore, default values, as inaccurate as these, have no place in new standards and guidance. We’ve already seen that the variance in calculated Y-values can be as much as 50% for a typical semi-detached house using the ACDs. Later in this article we will see that the margin of error can be many times higher in the case of apartments.
Surface temperature and health
Low surface temperatures can lead to reduced thermal comfort, discoloration and condensation on surfaces and mould growth. Typically this is most accentuated where air currents can’t reach and thermal bridging is naturally highest, such as in corner closets or behind beds. In extreme cases the whole wall can be covered in mould. Low surface temperatures lead to at least a more frequent need to maintain and decorate and at most to failed works and health issues. As the levels of humidity in Irish dwellings are often higher than European norms,17 when there is a lack of ventilation, including proper extraction, very high levels of surface condensation can result.
15Comments included reference to the fact that the British civil servants removed the default Y-value for their accredited construction details as soon as they made calculated ones possible in 2010
16Regulatory Impact Analysis – Proposed amendments to Building Regulations Part L and Technical Guidance Document L, issued by DoEHLG in July 2010, downloadable from technical guidance section of www.environ.ie
17Remember general external humidity levels in Ireland are often higher than most places in Europe. We need better ventilation than the rest but we have the worst!

Table 2: calculated Y-values for the example house using tables D1-D5
It is no surprise that the cold spell before Christmas led to vents being blocked and extreme levels of surface condensation nationwide, followed by warmer weather during which mould bloomed – bringing a rash of calls to this office about mould-laden houses and apartments. We generally see inadequate insulation and no vents, blocked vents or inappropriately installed vents. We almost never see any extract ventilation.18 It’s as if Irish people, from legislators to architects to builders and homeowners, just can’t see the link between warmer surfaces, better extract ventilation and better health. Incidentally, the recent fuel poverty conference hosted by Energy Action showed a clear correlation between badly built houses, low internal temperatures and increased risk of respiratory disorders, strokes and worse.
Besides their impact on heat loss, and thus energy bills, thermal bridges are a cause of local drops in surface temperature. The risk of surface condensation in the vicinity of a thermal bridge is measured by the temperature factor (fRsi), a fraction indicating the lowest internal surface temperature relative to the temperature difference between inside and outside. Values close to 1.0 are healthy and mean that surface temperatures are close to the internal air temperature. TGD L and BS 5250 state that the temperature factor should be greater or equal to 0.75 to avoid the risk of surface condensation.

Figure 5: different windows and houses but same story. In internally insulated dwellings condensation occurs where the insulation is missing and in time, without extract ventilation, will lead to mould

Figure 6: two approaches to insulate the wall of House A to 0.27 W/m²K. Left: external insulation, even if interrupted at the boundary line, warms the existing wall and locally raises surface temperature at the corner of neighbouring House B. Right: Internal insulation cools the existing wall creating a cold spot at the same corner of House B
With external insulation, the impact of thermal bridges is pretty much limited to the increased heat flow. Materials within the insulated envelope are kept warmer and therefore drier, preventing inner condensation and mould problems. Internal insulation is more problematic in that the temperature of the existing wall becomes colder making interstitial condensation more likely: this can be seen graphically looking at house A in figure 6. Where there is a break in the continuity of internal insulation, the risk of surface condensation grows greatly. Ensuring continuity of insulation and the vapour control layer and maintaining the temperature factor above 0.75 are both critical for successful internal insulation in retrofits. Party walls and internal load bearing walls can be particularly problematic: the rule of thumb is that these need to be insulated as much as one metre from the line of the external envelope to avoid surface condensation: calculation and measurement bear this out.
A case study supporting a local authority
Building Life Consultancy carried out a study for Dublin City Council on the retrofit of the Glover Court flats near St Stephen’s Green. While the retrofit works were funded by the Department of the Environment as a test case, working with us to analyse relative value was purely an initiative of Dublin City Council’s architects department.
This particular building is characterised by an ‘expressed’ structure wherein the concrete floor slabs of the flats, which are also the decks of the walkways, become a feature of the elevation flush to the cavity walls. Equally the vertical frame elements are often attached to party walls of flats (see figure 7). These concrete elements clearly bridge the thermal envelope allowing an easy path for heat to escape. For this reason we felt that a strong focus on thermal bridging was crucial. A retrofit strategy that might be judged acceptable elsewhere could result in very high levels of heat loss in this case.

Figure 7: close-up showing the exposed concrete frame
18We do not consider kitchen extract hoods and tiny intermittent fans over showers adequate in this context.
Dublin City Council had a range of alternative propositions and needed guidance as to why, and by how much, one was better than the other. We had several exploratory meetings and carried out approximately 150 thermal bridge calculations across the four different options assessing Ψ-values and temperature factors for junctions in a limited number of indicative flats. With our understanding of architecture and building physics, we could argue the relative merits of various strategies at different levels.
Due to continued occupancy, all options featured external insulation, from rain screen to externally insulated façade systems, and cavity filling where possible. As the budget was limited and the rear of the building could have little done to it for a variety of reasons, the best possible upgrade was simply impossible. The focus was, therefore, on the best possible compromise which would ensure that most units had a BER of at least B3 and that a good temperature factor was achieved throughout. Initially, all versions retained the original open balconies. In the process of the research and discussions, we developed option P, which enclosed the balconies as winter gardens wherein the new glazing – which may be left open for most of summer – formed the thermal envelope in the heating season. This eliminated a large number of thermal bridges. A humidity-triggered ventilation system for each flat was another key feature of the final version.
For each of the retrofit options, we calculated the heat loss due to plane elements and linear thermal bridging in a number of indicative flats. Table 3 shows the results for the two types judged most typical: a mid-mid duplex and a mid-roof duplex flat. It shows the heat loss associated with thermal bridging for both apartments, expressed as total heat loss (W/K) and averaged per envelope area (i.e. Y-value, in W/m2K).

Table 3: thermal bridge heat loss & Y-value compared for existing and various retrofits
Looking at a mid-mid apartment for the existing building, we can see that additional heat loss through junctions equals 27.96 W/K. Turning this number into a calculated Y-value gave us a figure of 0.52 W/m2K. Bear in mind this is 3.5 times the heat loss of the default figure recognised by Deap for thermal bridging (0.15 W/m2K). This means BER certificates for these units using the default value would seriously underestimate the actual heat loss.
How flats and apartments will force a change
Apartments, or flats, are very different to other dwellings in that they can have an extremely small envelope area in relation to junction length, especially mid-mid units. Therefore the extent of thermal bridging in relation to envelope area (the Y-value) can become huge. The existing mid-mid flat is a good example of this (see table 3): it has less thermal bridge heat loss than the mid-roof one in absolute terms (W/K), yet its Y-value is markedly higher. This reinforces the earlier point that a schedule of default Y-values is needed for existing dwellings to take these kinds of issues into account. Note that even the very best Y-value listed is poorer than the current default of 0.15.
Bear in mind, even though the thermal bridge heat loss and Y-values for options D and M are not much different from the existing, the U-values after completion of works would be much lower. This means the percentage of heat being lost through thermal bridging as opposed to plane elements would be far greater than before. When we look at option P things improve significantly. The most interesting finding is that the heat loss rate at junctions has now come down to 16.04 W/K. Its Y-value, 0.33 W/m2K, is 40% lower than the averaged Y-value of the other 3 cases studied. Clearly, it is the best of the three retrofit alternatives, even if its Y-value is still twice the poorest figure that the Regulations and Deap acknowledge.

Figure 8: a street view of the existing building and artist’s rendering of option P
At this point, it is worth looking at the impact of the relatively uninsulated rear of the building. Looking at calculations relating to front and back confirms that the poorest thermal bridge values for option P are generally to the rear and that they are negatively impacting upon the values we saw in table 2 above. If the most common flat of all, the mid-mid flat, was retrofitted consistently to the standard of the front of option P, its average Y-value would drop to 0.17 W/m2K – at last close to the default value in Deap. It can thus be seen that if Dublin City Council were able to overcome some of the constraints to the rear of the building, an option P+ would likely provide a highly acceptable, and relatively uniform, thermal upgrade.
Not surprisingly poor temperature factors related to poor insulation values. Shockingly, there were values as low as 0.285 for certain flats of the existing building – far below the 0.75 threshold at which surface condensation becomes a risk. No doubt maintenance regimes must be elevated by this, but more importantly occupant comfort must be compromised. The average values for the front of option P, or all of option P+, were in the 0.90 range: very healthy.
Conclusion
We hope this article has made a reasonable case that:
- looking at U-values alone gives a false impression of the level of heat loss through the external envelope. There can be a large ‘hidden’ additional heat loss in highly insulated new builds – and even more so retrofits – if thermal bridging is not addressed;
- thermal bridging is generally misunderstood and not properly accounted for in the current building regulations. Its importance will grow, and industry awareness must grow quickly, as we move to higher standards;
- a calculated Y-value for new dwellings is now easier than ever and will significantly improve the accuracy of BERs – allowing a default Y-value of 0.08 W/m2K for new buildings to remain in place was a mistake;
- providing differentiated, significantly more accurate default Y-values for existing dwellings would not be difficult. The current default Y-value makes no sense when whole ranges of building types can perform many times worse;
- carefully considered and measured case studies are essential to the guidance we need moving forward. They must be funded.
Gritty, real studies, like the one for Glover Court, are essential for government officials, local authorities and the whole industry to learn from and base their standards on. Regrettably, compromises and budget limitations are, and will remain, a fact of life. However, it is only when different strategies are actually measured that it becomes clear when to compromise and when not, and what mix of compromises suits the particular situation best. Not scientifically measuring and analysing inputs and outcomes from case study buildings, on the basis that the budget won’t allow it, will only lead to mistakes, especially when the challenges of fuel poverty, low-carbon building, and higher levels of insulation and airtightness are so new.
The challenge for the new Minister for the Environment, Phil Hogan, is to continue the good work the previous minister and his team did in this regard. Less than 150,000 retrofit projects19 have been completed out of 1.6 million dwellings eligible for retrofit. As is clear from various sides, including this article, there is a lot for him to initiate and improve. We’re still at the start of the change that our built environment and industry need to see. We would contend that the best way for this nation to limit exposure to foreign fuel price hikes, to fight fuel poverty and to build community resilience in difficult times is to reduce the energy needs of families in their homes. As it is repeatedly said, building to a super-low energy standard and retrofitting 1.6 million dwellings will bring money into the economy, and create employment and skills, but the work itself must be considered, controlled and done well: we will only get one chance.
Building Life Consultancy will run its second course on the use of hygrothermal simulation, ‘WUFI Pro Heat & Moisture Simulation Workshop’ on 30-31 March 2011. They are also preparing a ‘Thermal Bridge Assessment Workshop’ that will meet the requirements of the upcoming NSAI thermal bridge assessor certification scheme. For further information visit www.buildinglifeconsultancy.com
19Based on figures for Home Energy Saving scheme and Greener Homes scheme
Related items
-
 New Ejot profile cuts thermal bridging losses by 25mm insulation equivalent
 -
 Ecomerchant now stocking Herschel Infrared heating products
 -
 The emergence of thermal bridging & thermal bypass
 -
 Zyle Fenster now using Triotherm thermal brackets
 -
 Prodomo offer certified thermal brackets for windows and doors
 -
 Save energy by using Aircrete for the whole inner leaf - Mannok
 -
 Panasonic welcomes new Green Homes Grant
 -
 Iso Chemie Winframer gets BBA approval
 -
 Partel launches recycled PET structural thermal break
 -
 Marc O'Riain: The golden age of solar water heating
 -
 Internet of Things dominates ISH 2019
 -
 Heat Merchants announces €4m expansion, 75 jobs & CO2 pledge