

- Insulation
- Posted
Breaking the mould - part I
Ill-considered attempts to upgrade a building’s thermal performance can not only fail to save energy, but can also create serious problems for occupant health and building structure alike. Leading green designer Joseph Little of Joseph Little Architects investigates the particular problems associated with dry-lining single-leaf concrete block walls
This article is the first of a series looking at upgrade options and issues associated with single-leaf walls of existing houses. This article will focus on insulated dry-lined concrete block walls of the ubiquitous housing estate house. This will include the findings of software that dynamically models moisture movement through the wall over several years. The article following this will look at a range of options for replacing existing dry-lining or installing dry-lining where it never was before, be that for a solid block wall of a 1950s house or a solid brick wall of an 1850s house.
In the last while I’ve been struck by two things in my practice: firstly, how many middle class clients with good jobs are now in doubt as to how much finance they can commit to making their house more energy efficient due to the crisis in the banking sector and voluntary or imposed stringency measures and secondly, how many of those relatively wealthy clients live in houses with no insulation at all, excluding perhaps 75mm of collapsed glass wool in the attic and less wrapped ineffectually around the cylinder. A six bedroom house in Foxrock, built in the mid 90s, with an appalling e5,000 a year heating bill comes to mind. The Home Energy Saving (HES) scheme is coming at exactly the right time to give confidence and fiscal aid to those who wish to make their houses more energy-efficient and comfortable, and also for a construction industry that badly needs employment.
Therefore all praise to minister Eamon Ryan and SEI for launching the HES scheme on 8 February. For the first time ever any owner of an existing home can access grant aid to better insulate their houses and heat them more efficiently. A total of e50m is allotted in 2009. If the scheme is widely adopted it could have a huge positive impact on national carbon emissions, energy efficiency and health if done well. The caveat is key: for this author ‘done well’ means renovating with a keen awareness of building physics, insulation, air-tightness, moisture movement, potential mould growth, ventilation and health. Doing the work well means that Irish builders, designers and specifiers need to re-think some aspects of how we build. We must make sure not to repeat mistakes of the past and homeowners must be ready to challenge pat solutions.
Health & home
Read the full Breaking the mould series
Part 1 - Part 2 - Part 3 - Part 4 - Part 5
Why this focus on mould, ventilation and health when thermally upgrading a house? Here are two of many reasons: Firstly, our population has the fourth highest incidence of asthma in the world and allergies are rising fast. Recently the World Health Organisation has found that as many as a third of Irish children now have asthma. Secondly, studies in other countries have found a close correlation between these diseases and the environments we spend so much of our time in: homes, offices and schools. In one study of 328 homes in southeast France, selected because residents had been admitted to hospital sick, Dr André Charpin1 and his colleagues found mould infestation in 44 per cent, mite contamination in 32 per cent and volatile organic compound (VOC) exposure in 9 per cent of the homes.
The issue of houses contributing to the ill-health of their occupants is not to do with ‘air-tight’ houses as some lobbies would say. We still probably have less than a hundred living units in the country where air infiltration has been reduced to 3m3/m2/h under pressure test conditions. The issue is hundreds of thousands of semi-leaky houses with no managed ventilation system, and little focus on moisture movement and the chemical constituents of building materials and furnishings. Ironically the houses of our great-grandparents which had gales blowing through them, roaring fires (giving good radiant heat) and a small range of natural building materials were healthier places than those we’ve been building for the last thirty years.
In contrast, a well-insulated house with very low air infiltration (in other words air leakage), good orientation and natural light, a well-design managed ventilation system, perhaps a radiant source of heat and a well-thought out palette of natural materials must be a healthy, healing place to live… as well as very energy efficient.
Single leaf walls
The walls of greater Dublin housing estates include mass concrete built in the inter-war years (for instance in Crumlin), un-insulated solid and hollow concrete blocks in the 1950s, 60s and 70s (estates in Raheny) and dry-lined hollow block from the late 70s till today (estates from Blackrock to Rochfort Bridge). It’s ironic that these walls are seen as being very different to the massive brick walls of Georgian townhouses and the rubble walls of Ireland’s vernacular buildings. While they are quite different in terms of the thickness of the walls and the materials that went into them, they’re very similar in one critical respect: they are all ‘single leaf’ masonry constructions.
This means the same masonry wall holds up the building, isolates the inside environment from the outside, and buffers wind-driven rain on the outside and moisture generated inside. As such it is subject to a complex range of forces as temperature, air pressure and moisture content change through the year across its width. In other forms of construction some of these forces are separated. For instance a well-built cavity wall, which has an inner leaf of timber or block interlinked but continuously separated from an outer leaf. The cavity isolates moisture gained from external conditions from moisture gained from the room. Both leafs have the potential to dry out towards the cavity or their other face.
The room face of an un-insulated single leaf wall can be within a few degrees of room temperature as it is warmed by the radiant heat of a fire or the moister convection currents of a wall-mounted convector heater. This means that the point where vapour condenses (the ‘dew point’) can be further into the masonry. If built with the right materials moisture tends to continue migrating slowly outwards. Switch off the heat in winter, or increase the amount of moisture being produced in the room, and the dew point can move back to the room face of the wall. How often have we all felt walls that were not only cold but damp to the touch?
It comes as a surprise to many people, even those within the industry, that every dry-lined wall buildup, no matter how good, will result in vapour condensing inside it every winter. This is because the insulation isolates the masonry wall so that its room-face cannot warm as before and consequently becomes more uniformly cool and also wetter.2 This is typically where the most extreme temperature change takes place and vapour condenses.
When a material or surface is warmer than about 15oc, relative humidity is greater than 75 per cent and convection currents or radiant heat are unavailable the potential for mould growth is high. A well-designed system is one that thus limits the amount of moisture and vapour (water as liquid or as gas) reaching this critical point and then allows whatever does reach there to dry out as quickly as possible. Given the health issues associated with mould it may be argued that good dry-lining must primarily be about careful management of water and secondarily about retaining heat!
The author believes that a conservation-based approach is the appropriate one to apply in upgrading all single skin walls, regardless of their age. A conservation architect and builder are trained to look at each building differently and to be very aware of the impact of orientation, exposure and the original building materials. Every step must allow the wall to dry out, generally in both directions. Ideally materials should be graded based on their vapour permeability: least permeable on the inside, most permeable facing the cavity or the elements.
, such as those supplied by FBT")
In spite of their poor performance nine inch hollow blocks have been widely used in Irish construction over the past 50 years, not to be confused with high performance poroton blocks (right), such as those supplied by FBT
The curious case of hollow block’s conductivity
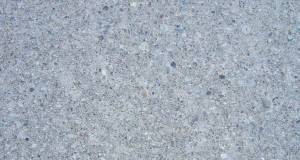
A hollow block wall, also known as a cavity block wall, should not be confused with a cavity wall. As can be seen in the photo, the two faces of a hollow block, each about 40mm wide, are linked by three cross members or ‘webs’ of circa 35mm thick. When built the resulting large hollows of each block become vertically linked the whole way up the wall (see article title image). They are also quite different from cellular poroton blocks such as those offered by Wexford-based FBT for a number of reasons. The latter has naturally better insulating characteristics, its terracotta material is more homogenous but less dense than the concrete found in blocks, and each cell is closed-off from those in the blocks above and below by the thin-bed ‘mortar’.
Given that moisture can penetrate through the outer 40mm of a hollow block in driving rain conditions it is a saving grace of their design that the air movement that occurs in the passages encourages evaporation of this moisture. However this air movement must also reduce thermal performance in that any warmed air will naturally rise to be replaced by cooler air below, perhaps entering the wall at an inset ESB or gas box below. Surprisingly Technical Guidance Document L (2007) does not list the thermal conductivity of hollow blocks in Table A1, where other common building materials are listed. It does however give a figure of 0.21W/mK on page 56. This figure agrees with UCD’s Energy Research Group study in 2002 for the Irish Concrete Federation.3 Both documents list ISO 12524 (2000) as the source for conductivity values, however that standard doesn’t make any reference to hollow blocks at all! “Curiouser and curiouser,” said Alice. The author finds it hard to accept that a dry hollow block has a conductivity better than plasterboard (0.25W/mK) and only slightly poorer than hardwood timber (0.18W/mK). Could the ERG or the Irish Concrete Federation please supply the calculations that prove its 0.21W/mK conductivity?
")
Figure 2: A screen shot of a dynamic display of moisture movement in the wall (note: this wall has a plastered face between block and insulation so is not directly comparable to buildups studied in Figure 3)
In an interesting article published in the Architect’s Journal way back in 19804 Alec Loudon, consultant to Harry Stranger Laboratories, stated that the conductivity of wet masonry can be double that of its dry state. How a wall build up deals with moisture ingress is therefore critical. He went on to highlight a BSRIA5 paper that had just been published which had found poor thermal performance in slotted and hollow blocks due to the shape of the concrete:
“…recent papers have provided evidence that the BRA 668/68 procedure can seriously over-estimate the thermal resistance of slotted block-work…. This is because the actual heat flow is not perpendicular to the face of the blocks; the thermal resistance is reduced because the flow lines concentrate in the conducting concrete webs and spread out on either side of them.”
One may infer that the geometry of the block results in increased thermal conductivity adjacent to the webs. Coincidentally a graph which accompanied the article showed erroneous U-values then claimed by UK manufacturers, all clustered at 0.21W/mK.
The BSRIA paper may have been instrumental in leading to the gradual abandonment of hollow and slotted concrete blocks for single leaf wall construction of heated buildings in the UK from that time onwards. Needless to say a similar move did not occur in Ireland. It’s still used for the full social spectrum of housing in Leinster, while in the UK it’s used to build sheds. We suggest it’s time for a general review of hollow block’s performance and its appropriateness in Irish house building.
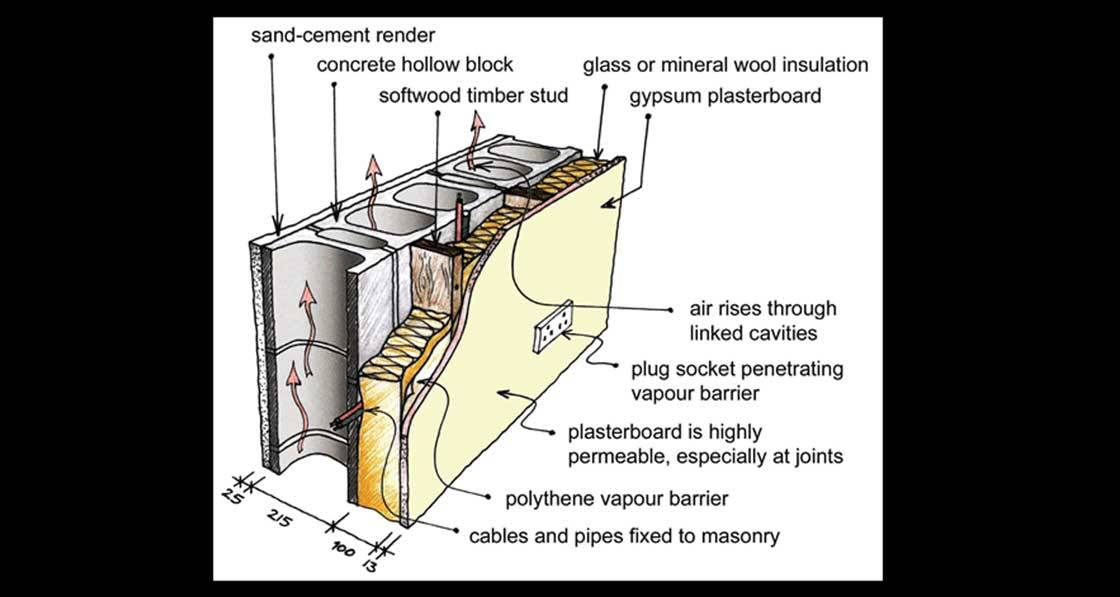
Dry-lined block walls
The typical buildup of a typical dry-lined hollow block wall is shown in the headline image of this article. Treated timber studs are mechanically fixed to the hollow blocks wall, services are also fixed to the wall for convenience. Mineral wool insulation is then friction-fitted between the timbers and a sheet of polythene is stapled to the studs to act as a vapour barrier. To my knowledge in this system the end of a vapour barrier sheet is trapped behind a timber stud or batten but not taped back to any other element. The significance of air-tightness and true continuity (from membrane to membrane, and membrane to wall or window, and so on) has only recently become clear.
Where required a ‘hole in the wall’ vent or the back box for a socket breaks through the vapour barrier. After occupancy the home owner may erect any number of shelves or fix pictures to the wall also tearing the membrane. The method for fixing the polythene vapour barrier, the services and the householder’s own actions all contribute to a very leaky vapour barrier. Water vapour can move with relative ease through the plasterboard (particularly at joints) into the insulation zone and condense where the temperature drops sufficiently. Lothar Moll showed very clearly in his article for Architecture Ireland in March 2007 how badly discontinuity or tears in the vapour barrier effects U-values.6
The author will write in a future article about alternate forms of dry-lining, several better than the one described here. However this traditional approach could be improved if required. Firstly a fibrous insulant more resistant to sag and better able to absorb moisture without collapsing could be friction-fitted into place, such as hemp wool. Next an ‘intelligent’ vapor control layer (VCL) such as Intello could be installed by continuously lapping and bonding the membranes to each other, sealing them back to floor, internal walls and windows in accordance with manufacturer’s instructions.
The membrane could then be separated by a services zone from the plasterboard. A limited amount of insulation can be installed there (less than a third of the total wall insulation) and the services run through. Then the homeowner could hang pictures to his/her heart’s content without effecting air-tightness and vapour movement.
A series of hygrothermic studies of dry-lined walls
The following studies look at temperature and moisture fluctuations in a dry-lined concrete block wall over several years. Up to recently such studies relied on steady state analysis using the Glaser method which dates back to 1958, and has now been replaced by transient hygrothermal simulation based on EN 15026 (2007). The simulation software used for this paper is called WUFI and was created by the renowned Fraunhofer Institute in Germany to that standard.

Figure 3: view of study 1’s dry-lined wall buildup in WUFI
With this new kind of simulation we can go beyond considering a wall buildup of dry materials, to investigating the performance of that wall, let’s say, in highly exposed conditions or see how a shower room with inadequate ventilation would effect it, or again how a plumbing leak or a rainy construction phase would alter the wall’s moisture content and temperature. If the simulation shows that the resulting moisture content reaches a critical level, or simply continues to grow year on year, we can be sure we will have some level of building failure on our hands. It is the kind of tool therefore that can help us assess a likelihood of reduced thermal performance, structural damage or even mould growth. It’s clear to this architect that every type of building envelope should be stress-tested in this way.
There are four studies all based on the dry-lined wall shown in figure 1, except that solid concrete blocks are substituted for hollow block. This is because WUFI’s library of materials doesn’t contain hollow block. Hopefully in the not-too-distant future the unusual geometries of the hollow block may be dynamically modelled. Equally as it is hard to model a torn or partially complete vapour barrier (which would allow ingress of room-generated moisture) we carried out a simulation with and without moisture present.
The four studies
- Study 1 features dry insulation and a polythene vapour barrier;
- In study 2 we maintain the dry insulation but swap the vapour barrier for an intelligent VCL;
- Study 3 features wet insulation and the original vapour barrier, and
- For study 4 the insulation stays wet but the intelligent VCL is again used.
One of the beauties of the software is that it is possible to locate virtual dataloggers (or monitors) in various locations throughout the wall buildup. In this case we have split the insulation in three to monitor moisture levels at critical points. Therefore the summary file shows insulation layers that are 1mm, 98mm and 1mm thick. The simulation covers a period of five years: a short period in a building‘s life but long enough to see long-term patterns.
The five years are repetitions of a weather design year for Dublin – that is a generalized year aggregated from several years of real data. The walls in this simulation are west-facing. They therefore experience quite a lot of wind-driven rain but also benefit from the radiant heat and drying effect of the afternoon sun. If they were oriented north there would be less soakage from wind-driven rain but also less drying potential. Thus a simulation of the four sides of the same house could show quite different results.
Moisture content and membranes
The four tables below show results from the four simulations in numerical order. The tables of the last three simulations are excerpted to save space. To make comparison easy we have highlighted the moisture content of the inner portion of the block-work at the beginning and end of the simulation in yellow, highlighted the neighbouring 1mm of insulation in orange and the overall moisture content of the wall in pink.
We also show four graphs of the moisture content changes for the same 1mm thick insulation zone. As this is beside the face of the block-work a high quantity of water vapour can condense here. Unlike the tables the graphs show strong seasonal fluctuations. The highest moisture content recorded is listed under ‘Max’ on the right of the tables. In studies 1 to 4 the moisture content of the 1mm insulation layer is highlighted. In the tables of studies 3 and 4 the moisture content of both layers of the block-work are also highlighted due to their significance.

Figure 4: view of study 1’s water content at beginning and end of simulation

Figure 5: graph showing daily moisture content fluctuations over 5 years in mineral wool nearest masonry in study 1

Figure 6: study 2 showing table excerpt and graph of moisture content in mineral wool nearest masonry (click for larger view)

Figure 7: study 3 showing table excerpt and graph of moisture content in mineral wool nearest masonry

Figure 8: study 4 showing table excerpt and graph of moisture content in mineral wool nearest masonry
Given how compressed a year appears in each graph the moisture content changes look almost violent. Not only is moisture content growing every winter and reducing every summer – it is also changing in distribution. Higher solar irradiation hitting the outside of the wall in summer and warmer temperatures in general change the vapour pressure movement from outward moving to inward. However as warmer air can also carry more moisture summer time is the period when most damage can occur to the structure if the moisture surrounding it can’t dissipate. It is thus imperative that the dry-lining system encourages summer drying in both directions.
The greater ability to allow moisture dissipate is the key difference between studies 1 and 3, and studies 2 and 4. The first two have a polythene vapour barrier; the second two have an intelligent vapour control layer (VCL). What makes the latter ‘intelligent’ is that, in the case of Intello, it can be more than fifty times more vapour permeable in summer than in winter. In winter it is as vapour resistant as the polythene vapour barrier would be (if it were installed correctly). In summer however the VCL becomes far more permeable allowing trapped moisture to escape back in to the room and evaporate to be taken away by the ventilation system. This is known as back diffusion.
Dr Künzel of the Fraunhofer Institute studied prototypes of these types of membranes in 1999 referring to them as ‘smart retarders’.7 The business sector then developed the prototypes he studied. There are two products in the Irish market that allow back diffusion to different degrees, though Intello from Ecological Building Systems is the better known.
Analysis
In Studies 1 and 2 the moisture content of the mineral wool is at natural ‘dry’ levels of 1.79kg/m3. Over the course of the five years the 1mm insulation layer in study 1 increases by circa 1/3 to 2.35kg/m3, in study 2 the moisture content actually reduces slightly to 1.64kg/m3. This is a sign that the back diffusion allowed by an intelligent VCL is resulting in a drier and therefore healthier environment within the wall.
Comparing both graphs a worrying trend become evident in study 1. Year on year its overall moisture content is clearly rising. One may surmise that in year ten it would be higher again than in Year five. In contrast a state of equilibrium appears to have been met in study 2’s graph. It can therefore be seen that even when a vapour resistant vapour barrier is correctly installed and fully sealed with all building materials installed dry this west-facing wall would slowly get wetter and in time more prone to mould and worse U-values. (see Figure 6)
Very dramatic results can be seen comparing the tables of studies 3 and 4 of moisture-damaged walls. In these cases we have increased the moisture content of the mineral wool from 1.79kg/m3 to 20kg/m3. Five years later the two tables show that the moisture content of the mineral wool has dropped to 10.43kg/m3 and 1.70kg/m3 respectively. Clearly both walls are drying out.
As a continuous vapour resistant polythene membrane prevents all but a tiny portion of moisture moving back into the room it is clear that both buildups have lost a significant portion of their interstitial condensation to the outside. The further improvement in study 4 can only be due to the action of the intelligent membrane. Its final moisture content (1.7kg/m3) is 4.5 times lower than the final moisture content of study 3. That figure is also lower than that of the dry insulation installed at the start of studies 1 and 2. That is to say even after a dowsing, albeit damaging, the insulation is now drier than it arrived off the truck. It may be concluded that if mould growth occurred at this point in the wall it is likely to have died back many years before, deprived of moisture. Now let’s look at the graphs of studies 3 and 4. Please note that the numbers given (in black) on the left side of each graph are over a far greater range than in studies 1 and 2 which is why they look so different. In both simulations there is a huge spike at the start (of the blue line) where moisture content grows to 258.39 and 246.23kg/m3 respectively. After the first four months both are down to about 80kg/m3. After that the significant advantage that back diffusion gives can be seen.
Study 3 shows a marked cycle of moisture rising and falling in the 1mm zone of insulation over the years. The winter extremes are all unhealthy at 258, 95, 85, 72, 62 and 48kg/m3. It is only at the end of summer that the moisture content drops below 15kg/m3 at all in each of the first three years. It may be surmised that only after seven or eight years will anything approaching equilibrium and healthier moisture content levels be reached. By then the insulation will have lost most of its insulating ability, most likely slumped, and mould will have flourished to the detriment of occupants’ health.
In contrast study 4 (the blue line) shows that the first year after the water ingress is almost as negative, but the similarity ends at the start of the first summer. The second year shows a huge drop in moisture content (its peak hitting circa 24kg/m3) but after that the moisture content levels appear to average around 2.5kg/m3 with maximums of circa 6 dropping to 4kg/m3. The fourth and fifth years look identical suggesting equilibrium has already been reached.
Two questions
The most interesting questions are:
- How does the moisture continue to rise in that 1mm wide zone of insulation each winter when it has clearly significantly reduced the summer before?
- How does the wetting of insulation with 20kg/m3 result in a moisture content more than ten times higher shortly afterwards in the 1mm zone of both studies 3 and 4?
Taking it for the moment that there are no gaps in the vapour barrier letting moisture escape from the room, the first question can be clearly answered by looking at the orange lines of graphs 3 and 4. Note that the scale on the vertical axis is different (see orange numbers). This line represents the humidity levels in the other 99mm of the insulation. In winter when humidity levels are higher and temperatures are lower outdoors than indoors there’s a strong vapour pressure movement from inside to outside which literally pulls water vapour through the wall to lodge at the point where the greatest temperature differential happens, the dew point. In a dry-lined wall this is usually but not always at the internal face of the masonry wall. The nearest few millimetres of insulation and block-work become saturated (see far right side of tables 3 and 4). In summer however solar radiation hitting the walls can warm them significantly more than inside and humidity inside can be higher than outside. This results in a redistribution of the moisture throughout the insulation (and rest of wall), this time more evenly than in winter: ideal conditions to allow back diffusion.
The orange line reflects this by the fact that its peaks occur at the blue line’s troughs and vice versa. At the same time, because it represents moisture movement across a far greater width (99mm) with conditions that are subtly different across that width, the changes are evened-out somewhat. This seasonal migration of moisture within the insulation explains most of the second question too. If 20kg/m3 of moisture is applied evenly over 100mm and vapour pressure then drives a large proportion of that to the face nearest the block-work then a figure as high as 258kg/m3, or far higher again, is indeed possible there.
There may however be another factor at work here as well. That is that at certain very high levels of moisture masonry materials can start to behave differently. As stated by Bernard Feilden in his book, Conservation of Historic Buildings:
“A characteristic feature of water distribution inside hard porous masonry materials is the existence of a critical water content that depends on the type of porosity and the nature of the material. Above the critical content, water can move freely in the liquid state inside the porous body, whereas below the critical value, water is held inside pores and can be removed only by evaporation. It is difficult to dry a masonry structure because the critical water content may be quite high.”8
We can already see from the maximum value given in the tables of all four studies that the external render can become completely sodden through the action of wind-driven rain. The author theorises that in these circumstances where the insulation has also become sodden (due to a range of possible events listed before) the critical water content could be reached in the block-work. Water from further heavy rainfalls could then move freely into the block-work staying longest where the drying effect of the winter sun would be likely to have least effect, deep in the wall.
The author suggests that this may have been a contributory factor to the extremely high moisture content also recorded in the nearest block-work to the 1mm zone of insulation in the first four months of studies 3 and 4. After the first summer a good amount of water diffuses to the outside, the moisture in block-work drops to below its critical water content and for the succeeding years moisture reverts to moving through the wall predominantly as vapour driven by pressure. Further research or simulation is needed here!
Conclusion
It should be obvious at this stage that the external envelope of any building (be it wall, floor, roof and so on) is a place of seasonal, and at times weekly, change in temperature, moisture content and vapour movement. In certain cases of inappropriate knowledge, installation or materials, the thermal performance of the insulation can change and so too can the likelihood of that building element hosting mould growth.
A simplistic equation might be useful to remember: where MC (moisture content) > DC (diffusion capacity) problem (either mould, structural or both)!
Designers and builders need to build with far more awareness of moisture movement. We need to build resilient systems - be that a wall, a ventilation system or the building itself. We need designs that can accommodate things going wrong and can ensure that both structure and the occupants’ health are safeguarded. The only answers are more education and understanding among designers, more understanding and care among builders, and a better selection of materials. In some cases it may mean clients need to pay more, in others no cost difference: but the pay-off for their health should be clear.
Across Irish society, particularly now with the Home Energy Saving scheme about to part-fund private sector thermal upgrade programmes, we need a public awareness campaign to emphasise concerns wider than chasing the lowest, cheapest BER rating. Our leaders could also learn from the approach of local governments in south-east France where free house surveys for sick clients are seen as another aspect of treating their illness and preventing more ill-health. When justified the surveys lead to grant aid for specific healthy house upgrade works. It’s a great example of all sides working for the common good. What value meeting important carbon-cutting standards if we do it in such a way that we go further up the world’s allergy or asthma tables? Who’ll thank us?
Read the full Breaking the mould series
Part 1 - Part 2 - Part 3 - Part 4 - Part 5
1Charpin-Kadouch, C., Charpin, D.A., et al (2006) ‘Housing and health counselling: Preliminary results of a new medical referral system in France’ Environmental Research
2Künzel, H.M., ‘Effect of interior and exterior insulation on the hygrothermal behaviour of exposed walls’, Materials and Structures, Vol. 31 (March 1998), pp 99-103
3Brophy, V & Lewis, O. et al. (2002), Consultancy Study for Irish Concrete Federation, ERG, Dublin
4Loudon, A., ‘Concrete Block-work – a check on thermal properties’, Architect’s Journal (December 1980), pp.1153-1154
5Garret, K.W., ‘An assessment of the calculation methods to determine the thermal performance of slotted building blocks’. Building Services Engineering Research and Technology, Vol. 1, No. 1 (1980)
6Moll, L., ‘Airtightness in Building’, Architecture Ireland, Vol. 225 (March 2007), pp.79-83
7Künzel, H.M., ‘Flexible vapor control solves moisture problems of building assemblies – Smart Retarder to replace the conventional PE film’, Thermal Envelope & Building Science, Vol. 23 (July 1999), pp.95-102
8Feilden, B.M. (2003), Conservation of Historic Buildings - Third Edition, Architecture Press, Oxford, p102
- Articles
- Design Approaches
- Breaking the mould
- thermal
- performance
- single leaf
- concrete
- block
- home energy saving scheme
- polythene membrane
Related items
-
 EU commissioner visits Ecocem as ACT cement line heads for 300,000-tonne capacity
 -
 Ecocem executive John Reddy becomes the first Irish President of the Institute of Concrete Technology
 -
 Techrete aims for net zero carbon by 2030
 -
 Kilsaran launch lower carbon cement with CarbonCure
 -
 New research gives boost to recycled concrete
 -
 The PH+ guide to greener concrete - reducing the climate impact of cement and concrete in buildings
 -
 Quinn get first Irish EPD for precast concrete
 -
 Green concrete breakthrough with waste wood & recycled concrete
 -
 Steeply sustainable - Low carbon passive design wonder on impossible Cork site
 -
 Low carbon concrete blocks now available in Ireland
 -
 Focus on whole build systems, not products - NBT
 -
 International - Issue 29